Disability pay gap report 2024
1. Purpose of the report
1.1. The Council is publishing its workforce disability pay gap on a voluntary basis. In the absence of a mandatory framework for reporting, the Council has chosen to replicate the regulations and measures used in gender pay gap reporting with some changes, to account for the different data sets, see 1.4 below. Therefore, this report includes:
- the mean and median disability pay gaps
- The mean and median disability bonus pay gaps
- the proportions of disabled and employees who received a bonus
- the proportions of disabled employees and employees with no disability in each pay quartile
1.2. The reporting data includes Council employees who have self-certified their disability status as either ‘disabled’ or as having ‘no disability’ and were employed on 31 March 2024. Apprentices or temporary employees are included if they fall within the reference period created by the snapshot date. Mirroring the gender pay reporting regulations, the data excludes schools-based staff and staff employed by Brighter Futures for Children, the Council’s Children’s Services Company.
1.3. The Council’s workforce equalities data is provided confidentially and voluntarily by individuals working for the Council. The Council encourages its workforce to share their equalities data to understand the workforce profile and plan actions to address inequalities. Not all employees choose to share their details. At the reporting date, 69.7% of the workforce disclosed whether they are disabled or have no disability. The remaining employees either have not shared their status or declined to specify.
1.4. The gender pay gap report compares two distinct groups – male and female – whereas the disability recorded falls into 2 broad categories: disabled, no disability, then there are groups where no data is available, blank (not recorded) and unspecified (chose not to answer). The way that gender is recorded for mandatory pay gap reporting means that there can be no blank or unspecified records. In calculating the mean and median differences, we have chosen to focus on those who have specified their disability status to give the most precise view of the disability pay gap in the Council, as people with blank or undeclared disabilities could either be disabled, or non-disabled.
1.5. The Council will publish this information on its website.
1.6 This report relates to the snapshot date of 31st March 2024.
2. Disability Pay Gap and Equal pay
2.1 Pay gap reporting is different to equal pay. Pay gaps measure the difference in average hourly pay between different groups. Unlike equal pay audits, which look at the difference in pay between people with different characteristics doing the same job, pay gap reporting looks at the wider picture across the workforce.
2.2 The disability pay gap is a measure of the difference in average ordinary earnings (excluding overtime) between employees with no disabilities and employees with a disability across the workforce. It is expressed as a percentage of the earnings of employees with no disabilities. Both the mean (average) and median hourly rates are reported.
2.3 The Equality Act 2010 makes it unlawful to discriminate (both directly and indirectly) against employees (and people seeking work) because of their disability. An employer can be equal pay compliant and still have a disability pay gap. The cause of a disability pay gap may not fall within the direct control of the employer and is likely to be due to other factors that impose a disadvantage on people with a disability without being explicitly discriminatory.
2.4 The Council supports the fair treatment and reward of all staff irrespective of disabilities or other characteristics. This report sets out the Council’s disability pay gap and provides reference to the Council’s action plan to tackle the gap.
3. Disability Pay Gap Reporting
3.1 Mean and Median Pay Gap Reporting: Reading Borough Council has a positive pay gap for the mean and a 0% gap for median gross hourly earnings.
3.2 Mean and median pay gap
| Rate | Not Disabled | Disabled | Disabled Staff earnings are: |
|---|---|---|---|
| Mean Hourly Rate | £19.44 | £19.04 | 2.05% Lower |
| Median Hourly Rate | £17.59 | £17.59 | 0.00% Lower |
3.3 Mean and median pay gap in bonus payments
| Rate | Not Disabled | Disabled | Disabled Staff earnings are: |
|---|---|---|---|
| Mean Bonus Rate | £945.83 | £0.00 | 100.00% Lower |
| Median Bonus Rate | £1000.00 | £0.00 | 100% Lower |
3.4 Proportion of disabled and non-disabled who received a bonus
| Employees | Not disabled | Disabled |
|---|---|---|
| FPREs total | 1162 | 72 |
| Proportion of all those receiving a bonus | 24 (2.1%) | 0 (0.0%) |
3.4.1 The Council does not have provision for the payment of bonuses within its terms and conditions. However, long service awards in the form of money meet the government’s definition of “bonus” for this report.
3.4.2 Long service awards at the Council are in recognition of achieving 20 years’ continuous service. This scheme provides a one-off money award of £1,000 for those achieving long service with the Council with the provision for employees to “trade in” all or part of the award for additional days’ leave, currently at the rate of £100 per day.
4. Supporting Narrative
4.1 The Council’s overall workforce disability profile based on this reporting data is 69.7% with no disability and 30.3% disabled. These figures exclude employees who have declined to provide their disability status.
4.2 The mean hourly rate of pay for disabled employees was £19.04. The mean hourly rate for employees with no disability was £19.44, this results in the reported 1.9% difference.
4.3 The median hourly rate of pay for disabled employees was £17.59. The median hourly rate for employees with no disability was £17.59, this results in the reported 0.0% difference.
4.4 Salary Quartiles:
4.4.1 Salary quartile reporting is calculated by sorting employees by their average hourly earnings, from the lowest to the highest, then splitting them into four equal quartiles to show the proportions of disabled employees and employees with no disability in each group. Definitions of the salary quartile information are shown below.
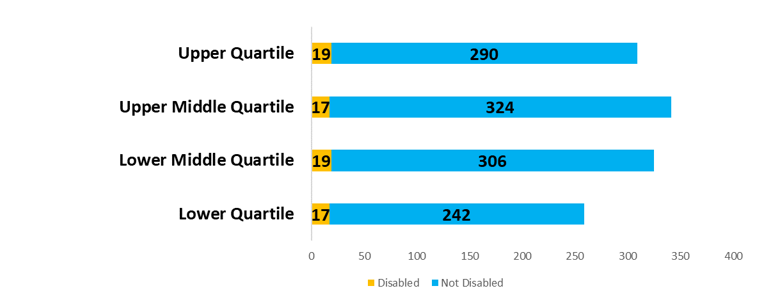
4.4.1: Number of Disabled and Not Disabled Staff in each pay quartile:
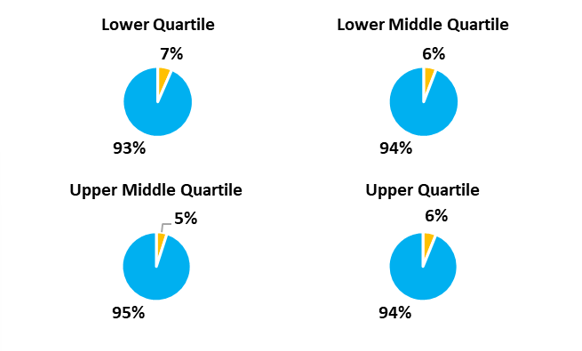
4.4.1: Proportion of Disabled and Not Disabled Staff in each pay quartile:
4.5 Pay & Grading. The Council’s annual pay policy statement provides details of the Council’s pay and grading arrangements.
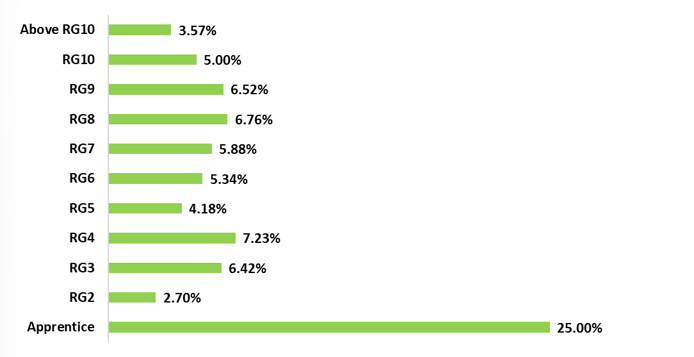
4.6 Workforce profile for disabled workers:
5. How figures compare nationally
5.1 The Office of National Statistics (ONS) reported a UK median disability pay gap of 12.7% in 2023, a gap which has remained relatively stable since 2014. This is higher than the RBC reported median pay gap of 0.0%. The ONS data for 2024 is yet to be released.
6. Summary & Actions
6.1 The Council is confident that its small disability pay gap does not stem from an equal pay issue. The Council has a structured pay and grading system to ensure all roles are graded using a recognised job evaluation system to make sure individuals receive equal pay for equal work.
6.2 the Council has an agreed Inclusion and Diversity Strategy – launched in January 2025 – and annual plans that set out actions to improve our performance in relation to all protected characteristics – this includes (for 2025) a commitment to developing a ‘disability statement’ which will set out our specific aspirations for this protected characteristic along with a detailed action plan to achieve them.
6.3 Work to improve self-disclosure rates continues in relation to disability disclosure as it does for all protected characteristics.
Appendix A
Hourly Pay Definition for the purposes of calculating the mean and median hourly rates.
Pay will include:
- basic pay
- paid leave, including annual leave, sick leave, maternity, paternity, adoption or parental leave (except where an employee is paid less than usual because of being on any such leave)
- area and other allowances
- shift premium pay
- pay for piecework
- bonus pay
It will not include:
- overtime pay
- expenses
Full-pay Relevant Employee Definition
“Full-pay relevant employee” means a relevant employee who is not, during the relevant pay period, being paid at a reduced rate or nil as a result of the employee being on leave. Employees who receive no pay at all during the relevant pay period, whether or not this is as a result of being on leave are excluded from the ethnicity pay gap calculations. “Leave” includes:
(a) annual leave
(b) maternity, paternity, adoption, parental or shared parental leave
(c) sick leave and
(d) special leave
Pay Quartiles
This calculation requires an employer to show the proportions of disabled employees and employees with no disability “full-pay relevant employees” in four quartile pay bands. This is done by dividing the workforce (so far as possible) into four equal sections to determine the lower, lower middle, upper middle and upper quartile pay bands. Where employees receiving the same hourly rate of pay fall within more than one quartile pay band, a relative proportion of disabled employees and employees with no disability receiving that rate of pay were assigned to each of those pay quartiles.
Last updated on 24/03/2025
Disability pay gap report 2024