Workforce profile
2023-2024
1 Overview
Reading Borough Council strives to be an inclusive and fair employer. The analysis of our workforce profile in relation to equalities is central to making sure that this happens. This report provides an overview of the range of people in the Council and serves as an evidence base to inform the Council’s equalities objectives, which form part of the Public Sector Equality Duty (Equality Act 2010). The information contained in this document is also reported to the Council’s Personnel Committee.
The Council actively encourages individuals from all protected characteristics’ groups[1] to be part of our team and highly values people’s individual skills and talents. The information included in this report is also used to understand whether the Council’s workforce reflects the demographic of the wider community and, if not, how inroads can be made to achieve this over time. Understanding the profile of employees also means that appropriate support and solutions can be delivered.
This report will be updated on an annual basis and the information provided is based on the last complete financial year (2023/24), unless otherwise indicated.
2 Vacancies, applicants, leavers and maternity leave
2.1 Vacancies and applicants
The average number of vacancies advertised per month from April 2023 to March 2024 has remained at a similar level to the previous year.
| Vacancies and applicants | 2019/20 | 2020/21 | 2021/22 | 2022/23 | 2023/24 |
|---|---|---|---|---|---|
| Average number of vacancies advertised per month | 33 | 20 | 36 | 43 | 42 |
| Number of applicants | 4,762 | 5,890 | 4,498 | 5,586 | 6,735 |
The ethnic diversity amongst applicants has increased. The number of White British applicants has dropped slightly compared to the last two years. While the number of applicants from Multi-Ethnic groups is 45.4%, there has been a small increase in applicants who have selected not to disclose their ethnicity compared to the last two years.
| Ethnic origin | 2019/20 | 2020/21 | 2021/22 | 2022/23 | 2023/24 |
|---|---|---|---|---|---|
| White: English/Welsh/Scottish/Northern Irish/British | 53.5% | 50.9% | 49.4% | 41.3% | 40.8% |
| White Other | 10.3% | 10.1% | 8.4% | 10.2% | 8.7% |
| Mixed/multiple | 4.5% | 4.0% | 4.7% | 4.4% | 4.7% |
| Asian/Asian British | 15.5% | 18.4% | 20.9% | 25.6% | 24.3% |
| Black/African/Caribbean/Black British | 9.6% | 9.2% | 9.9% | 11.7% | 14.8% |
| Other ethnic group | 1.3% | 1.0% | 1.6% | 1.9% | 1.6% |
| No value (Prefer not to say) | 5.2% | 6.4% | 5.1% | 4.9% | 5.2% |
The younger age structure of applicants has remained consistent over the years and implies that this age group is more likely to be looking for work. This increase in younger applicants is also reflected in the staff that have recently joined the council.
| Age range | 2019/20 | 2020/21 | 2021/22 | 2022/23 | 2023/24 |
|---|---|---|---|---|---|
| 16 to 29 | 35.0% | 36.5% | 33.3% | 36.0% | 31.8% |
| 30 to 44 | 37.5% | 35.6% | 36.3% | 37.1% | 38.3% |
| 45 to 59 | 19.6% | 18.4% | 21.5% | 19.0% | 20.9% |
| 60 to 64 | 2.6% | 1.9% | 3.2% | 2.4% | 3.2% |
| 65 to 74 | 0.6% | 0.4% | 0.4% | 0.7% | 0.8% |
| 75 and over | 0.0% | 0.03% | 0% | 0.0% | 0.0% |
| No value (Prefer not to say) | 4.7% | 7.1% | 5.2% | 4.8% | 4.9% |
The Council attracts more applications from women than men, the percentage of females applying has stayed the same for the last two years.
| Gender | 2019/20 | 2020/21 | 2021/22 | 2022/23 | 2023/24 |
|---|---|---|---|---|---|
| Women | 52.5% | 55.2% | 56.7% | 58.0% | 58.0% |
| Men | 46.1% | 43.1% | 41.1% | 40.4% | 40.4% |
| No value (Prefer not to say) | 1.4% | 1.6% | 2.2% | 1.7% | 1.7% |
A lower percentage of applicants’ state that they have a disability (0.7%) than the existing workforce (4.2%). The percentage of applicants who declare that they have a disability has increased in 2023/24 but the percentage of applicants who prefer not to say has also increased.
| Considered disabled? | 2019/20 | 2020/21 | 2021/22 | 2022/23 | 2023/24 |
|---|---|---|---|---|---|
| Yes | 3.9% | 0.8% | 0.8% | 0.5% | 0.7% |
| No | 84.9% | 18.4 | 13.5% | 10.4% | 9.0% |
| No value (Prefer not to say) | 11.2% | 80.9% | 85.7% | 89.1% | 90.3% |
2.2 Starters
Some demographic characteristics of starters vary from the existing workforce:
- 3.6% of the starters during 2023/24 reported themselves as being disabled, compared to 4.2% amongst the workforce.
- 27.5% of the starters were from non-White ethnicities, compared to the percentage of non-White British ethnicities in the general workforce (18.5%).
- A much lower percentage of starters are aged 45 and over (30.8% compared to 53.9% amongst the workforce).
- 65.0% of starters are female compared to those in the workforce (59.7 %).
2.3 Leavers
Voluntary labour turnover decreased in 2023/24 compared to the previous year.
| Rate | 2019/20 | 2020/21 | 2021/22 | 2022/23 | 2023/24 |
|---|---|---|---|---|---|
| Labour turnover rate (all reasons) | 16.7% | 11.0% | 16.0% | 14.6% | 13.7% |
| Labour turnover rate (voluntary resignation) | 10.7% | 8.4% | 11.8% | 13.6% | 12.6% |
Further information on the reasons for staff leaving employment at the council are shown below. Voluntary resignation is the main reason, followed by the expiration of temporary contracts and retirement.
| Reason for leaving | 2019/20 | 2020/21 | 2021/22 | 2022/23 | 2023/24 |
|---|---|---|---|---|---|
| Death in Service | 2 | 4 | 2 | 1 | 1 |
| Dismissal | 3 | 5 | 3 | 4 | 8 |
| Dismissal – Ill Health | 2 | 3 | 4 | 0 | 0 |
| End of Fixed Term Contract | 16 | 19 | 13 | 0 | 18 |
| End of Temporary Contract | 0 | 0 | 0 | 20 | 0 |
| Mutual Agreement | 6 | 9 | 12 | 9 | 8 |
| Redundancy | 13 | 6 | 5 | 5 | 0 |
| Resignation | 146 | 108 | 204 | 176 | 181 |
| Retirement | 20 | 26 | 18 | 22 | 19 |
| Retirement – Ill Health | 3 | 3 | 6 | 5 | 7 |
| Retirement- Redundancy | 4 | 0 | 0 | 3 | 0 |
| Ill Health Dismissal | 0 | 0 | 0 | 0 | 1 |
| Early Retirement | 1 | 2 | 0 | 0 | 0 |
| Settlement Agreement | 1 | 1 | 1 | 0 | 0 |
| TUPE Transfer | 1 | 0 | 0 | 0 | 0 |
| Unsuccessful Probation | 8 | 3 | 2 | 4 | 3 |
| Total | 226 | 189 | 270 | 249 | 246 |
Some demographic characteristics of leavers vary from the existing workforce:
- 3.7% of leavers during 2023/24 reported themselves as being disabled, compared to 4.2% amongst the workforce as a whole.
- The number of leavers (69.5%) in 2023/24 that were White British is broadly consistent with the proportion in the existing workforce (73.3%)
- A slightly higher percentage of leavers in 2023/24 are aged 55 and over (31.3%), compared to 28.6% amongst the workforce.
- A higher proportion (60.6%) of leavers in 2022/23 were female, compared to 59.7% of the workforce.
2.4 Maternity leave
The vast majority of staff members that go on maternity leave do return to work at the Council, with 76.7% of those that went on maternity leave during 2023/24 returning.
3 Demographic characteristics of the workforce
3.1 Disability
Not all employees choose to share their details. At the reporting date, 69.7% of the workforce disclosed whether they are disabled or have no disability. The remaining employees either have not shared their status or declined to specify.
4.2% of the workforce have declared that they consider that they have a disability. This is in line with previous years.
To ensure that our employment opportunities are accessible to disabled people, we fully commit to being a ‘Disability Confident Employer[2]’. We actively promote employment opportunities to disabled applicants, providing information in Plain English and offering accessible formats where necessary to facilitate the recruitment process. As part of our standard practice for staff, we offer specialist support such as Occupational Health and counselling.
| Disability | 2019/20 | 2020/21 | 2021/22 | 2022/23 | 2023/24 |
|---|---|---|---|---|---|
| No | 86.9% | 80.8% | 73.2% | 68.2% | 65.2% |
| Yes | 3.7% | 3.8% | 4.1% | 4.1% | 4.2% |
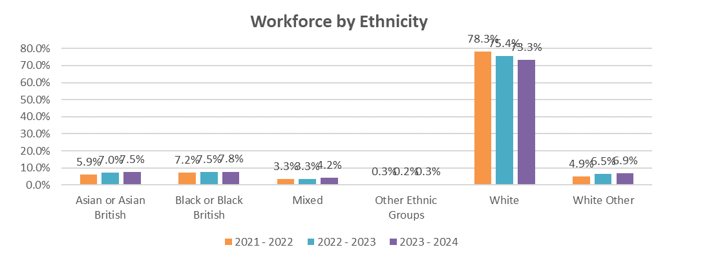
3.2 Ethnicity
73.3% of the Council’s workforce describe their ethnicity as White English/Welsh/Scottish /Northern Irish/ British. This percentage has increased compared to other years. The percentage of the workforce in Non-White ethnicities has increased in the last two years and stands at 18.5% in 31st March 2024. The proportion of staff who identify as Black/Black British has shown an increase from 6.9% in 2020/21 to 7.8% in 2023/24.
| Ethnicity | 2019/20 | 2020/21 | 2021/22 | 2022/23 | 2023/24 |
|---|---|---|---|---|---|
| White: English/Welsh/Scottish/Northern Irish/British | 76.7% | 75.4% | 74/1% | 71.1% | 73.3% |
| White Other | 4.3% | 4.4% | 4.7% | 6.1% | 6.9% |
| Black/Black British | 6.3% | 6.0% | 6.9% | 7.1% | 7.8% |
| Asian/Asian British | 4.9% | 5.3% | 5.6% | 6.6% | 7.5% |
| Mixed ethnic background | 2.7% | 2.8% | 3.1% | 3.1% | 4.2% |
| Other ethnic groups | 0.3% | 0.3% | 0.3% | 0.2% | 0.3% |
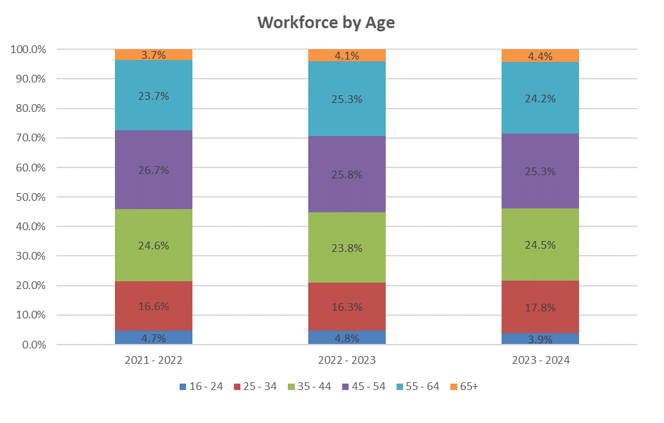
3.3 Age profile
A low percentage of the workforce is aged 16 to 24 (3.9%) compared to the percentage of staff aged 55 to 64 in employment (24.2%).
The Council is pro-actively working with local schools and colleges to promote employment opportunities. This aims to encourage young people to take up work at the council. The Council has a formal work experience programme with local schools and has had success in supporting young people who have joined the work experience programme to progress to apprenticeship opportunities within the Council.
The percentage of the Council’s workforce aged 55 and over is 28.6% which is slightly higher than the number of staff aged 35 to 44 (24.5%). As more of the workforce moves into the 55 and over age range there is an increased importance on ensuring that in addition to retention initiatives to retain older workers, a robust succession planning mechanism is embedded to deliver business continuity, top talent, and leaders and managers of the future.
| Age | 2019/20 | 2020/21 | 2021/22 | 2022/23 | 2023/24 |
|---|---|---|---|---|---|
| 16-24 | 4.7% | 4.5% | 4.7% | 4.8% | 3.9% |
| 25-34 | 17.1% | 17.4% | 16.6% | 16.3% | 17.8% |
| 35-44 | 23.3% | 23.6% | 24.6% | 23.8% | 24.5% |
| 45-54 | 28.6% | 28.5% | 26.7% | 25.8% | 25.3% |
| 55-64 | 23.0% | 22.8% | 23.7% | 25.3% | 24.2% |
| 65+ | 3.3% | 3.2% | 3.7% | 4.1% | 4.4% |
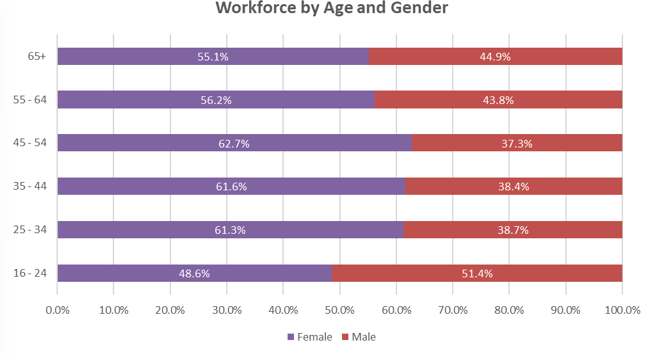
3.4 Gender
The Council employs more female staff, with 59.7% females and 40.3% males, this distribution dropped compared to 2022/23 as shown in the table below.
The gender split by age in 2023/24 shows a predominantly larger percentage of female employees in all age groups but is particularly high in the 45 to 54 range (62.7%) and the 35 to 44 range (61.6%).
| Year | 2019/20 | 2020/21 | 2021/22 | 2022/23 | 2023/24 |
|---|---|---|---|---|---|
| Female | 59.1% | 58.7% | 59.8% | 60.8% | 59.7% |
| Male | 40.9% | 41.3% | 40.2% | 39.2% | 40.3% |
| Age group | Women | Men |
|---|---|---|
| 16 to 24 | 48.6% | 51.4% |
| 25 to 34 | 61.3% | 38.7% |
| 35 to 44 | 61.6% | 38.4% |
| 45 to 54 | 62.7% | 37.3% |
| 55 to 64 | 56.2% | 43.8% |
| 65+ | 55.1% | 44.9% |
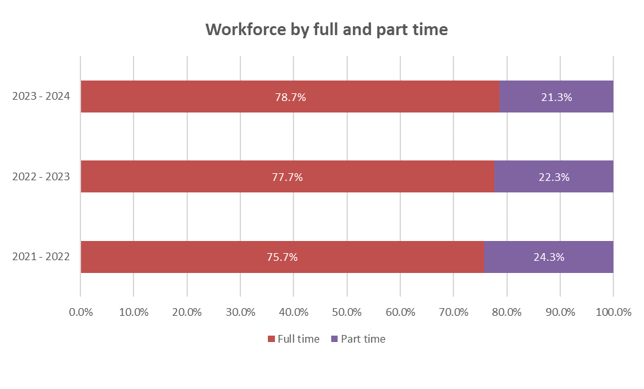
3.5 Full time and part time
About three quarters of employees within the council work full-time, whilst 22.3% work part-time. There has been a steady increase of staff in full-time work compared to part-time. Both full-time and part-time staff are afforded the benefit of a wide range of flexible working options, such as working compressed hours or working remotely, which benefit both the individual and the organisation.
| Contract type | 2019/20 | 2020/21 | 2021/22 | 2022/23 | 2023/24 |
|---|---|---|---|---|---|
| Full time | 73.6% | 75.4% | 75.7% | 77.7% | 78.7% |
| Part time | 26.4% | 24.6% | 24.3% | 22.3% | 21.3% |
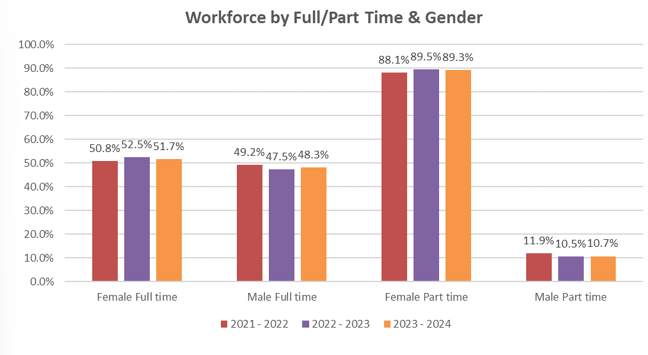
3.6 Full time and part time by gender
A much greater percentage of females work part-time than males (89.3% compared to 10.7%). The percentage of males and females working full or part-time has remained relatively stable over time.
| Gender | Contract type | 2019/20 | 2020/21 | 2021/22 | 2022/23 | 2023/24 |
|---|---|---|---|---|---|---|
| Women | Full time | 49.3% | 49.7% | 50.8% | 52.5% | 51.7% |
| Men | Full time | 50.7% | 50.3% | 49.2% | 47.5% | 48.3% |
| Women | Part time | 86.6% | 86.3% | 88.1% | 89.5% | 89.3% |
| Men | Part time | 13.4% | 13.7% | 11.9% | 10.5% | 10.7% |
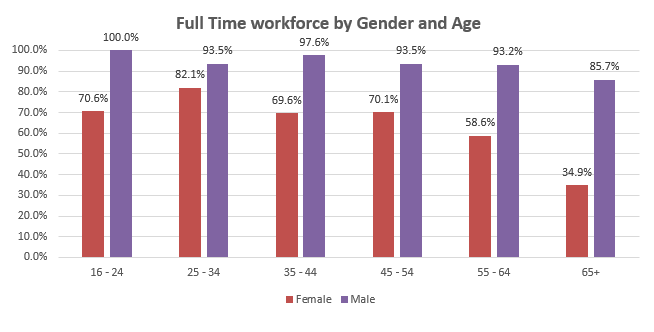
3.7 Full time and part time by gender and age
Approximately 70% of females in the following age groups work full time, 16-24, 35-44 and 45-54. The highest proportion working full time is found the 25-34 age group, whilst the lowest is aged 65+ (34.9%)
More than 90% of males between the ages of 25 to 64 work full-time, and in the 16 – 24 age group 100% work full time, while in the 65+ category 85.7% work full time. Again this is likely to be due to flexible retirement/working arrangements which enable employees to have a gradual route into retirement if they wish.
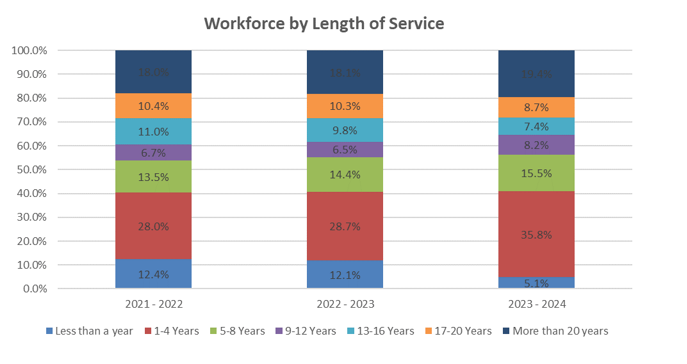
3.8 Length of service
2023/24 shows a large decrease in the proportion of staff that have worked at the Council for less than a year compared to 2022/23 and has increased for staff who have worked 1 to 4 years’ and 5 to 8 years’ service compared to 2019/20.
| Length of service | 2019/20 | 2020/21 | 2021/22 | 2022/23 | 2023/24 |
|---|---|---|---|---|---|
| Less than a year | 5.9% | 8.5% | 12.4% | 12.1% | 5.1% |
| 1 to 4 years | 29.2% | 29.2% | 28.0% | 28.7% | 35.8% |
| 5 to 8 years | 12.4% | 14.0% | 13.5% | 14.4% | 15.5% |
| 9 to 12 years | 11.6% | 9.1% | 6.7% | 6.5% | 8.2% |
| 13 to 16 years | 11.9% | 10.5% | 11.0% | 9.8% | 7.4% |
| 17 to 20 years | 10.9% | 10.6% | 10.4% | 10.3% | 8.7% |
| More than 20 years | 18.1% | 18.0% | 18.0% | 18.1% | 19.4% |
3.9 Length of service by disability
Due to the low numbers recorded for employees with a disability it is difficult to note any particular trends pertinent to their length of service. The data is potentially disclosive and so is not shown here.
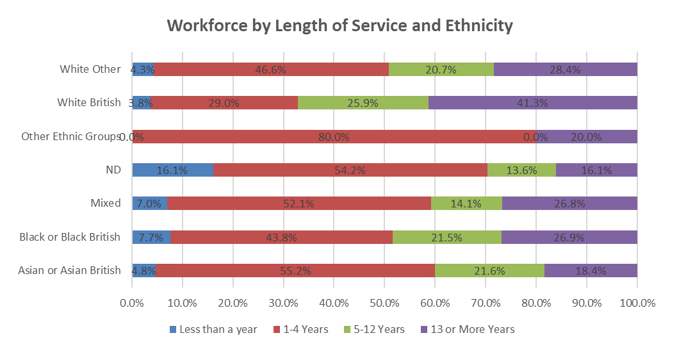
3.10 Length of service by ethnicity
Due to the low numbers recorded for employees with a disability it is difficult to note any particular trends pertinent to their length of service. The data is potentially disclosive and so is not shown here.
| Ethnicity | Less than a year | 1 to 4 years | 5 to 12 years | 13 + |
|---|---|---|---|---|
| Asian/Asian British | 4.8% | 55.2% | 21.6% | 18.4% |
| Black/Black British | 7.7% | 43.8% | 21.5% | 26.9% |
| Mixed | 7.0% | 52.1% | 14.1% | 26.8% |
| Prefer not to say | 16.1% | 54.2% | 13.6% | 16.1% |
| Other ethnic group(s) | 0.0% | 80.0% | 0.0% | 20.0% |
| White British | 3.8% | 29.0% | 25.9% | 41.3% |
| White Other | 4.3% | 46.6% | 20.7% | 28.4% |
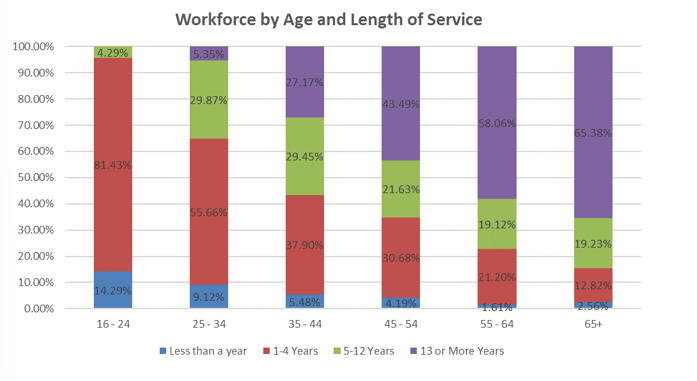
3.11 Length of service by age profile
There are more people in the 35 and over category who have served for longer periods and more people aged 34 and below that have served less than a year. The majority of those aged under 35 have worked at the authority 1 to 4 years. The percentage of staff that have worked at the organisation for fewer than four years declines with age. This is because the correlation between age and length of service tends to be positive, as older employees tend to have been in the organisation longer, or vice versa.
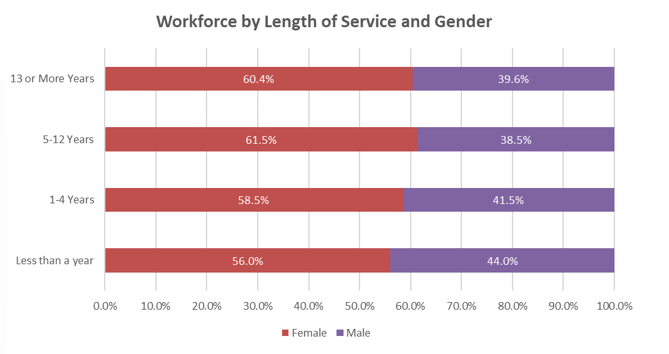
3.12 Length of service by gender
The percentage of staff by gender is similar across the different service lengths, although a lower percentage of those that have service of 5 or more years are male.
| Gender | Less than a year | 1 to 4 years | 5 to 12 years | 13 + |
|---|---|---|---|---|
| Female | 56.0% | 58.5% | 61.5% | 60.4% |
| Male | 44.0% | 41.5% | 38.5% | 39.6% |
3.13 Pay grade
This section features information broken down by salary grades.
Grade explanation
- RG2 to RG6 cover a wide range of administrative, technical, clerical and manual roles. For the purpose of this report these grades also include apprentices, for whom there are separate pay arrangements.
- RG7 to RG8 cover a range of professional and first line manager / supervisory roles.
- RG9 to RG10 cover a range of senior professional and middle manager roles.
- RSMD and above cover senior managers, Coroners, Assistant and Deputy Directors, Executive Directors and the Chief Executive
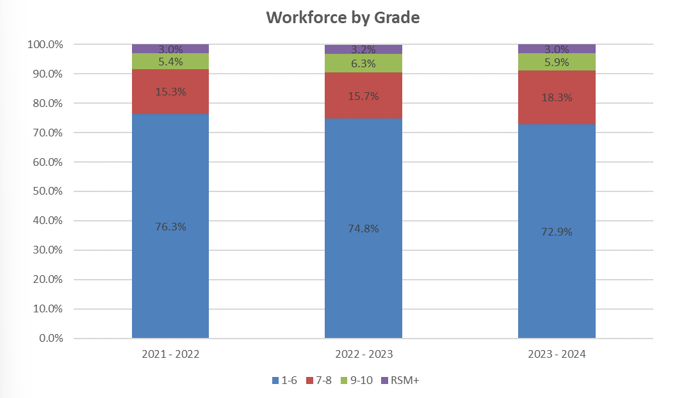
The percentage of staff within each pay grade has remained relatively stable over time as shown below.
| Grade | 2019/20 | 2020/21 | 2021/22 | 2022/23 | 2023/24 |
|---|---|---|---|---|---|
| Grades 2 to 6 | 78.3% | 77.7% | 76.3% | 74.8% | 72.9% |
| Grades 7 to 8 | 15.1% | 15.4% | 15.3% | 15.7% | 18.3% |
| Grades 9 to 10 | 4.3% | 4.6% | 5.4% | 6.3% | 5.9% |
| Grades RSM and Above | 2.3% | 2.3% | 3.0% | 3.2% | 3.0% |
3.14 Grade by disability
Due to the small number of staff that identify themselves as having a disability in each grade group, the data is potentially disclosive and so is not presented here. The Council continues its commitment to be a Disability Confident Employer to encourage applications from disabled candidates and promote development for existing disabled members of staff.
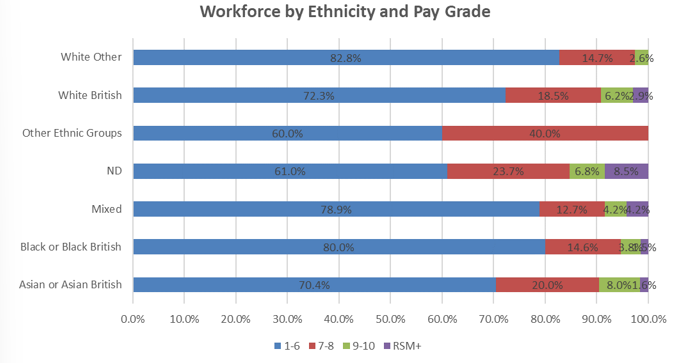
3.15 Grade by ethnicity
There is a lower percentage of White British staff in RG2 to RG6 than the percentage of staff from non-White British ethnic groups. This group also contains the highest proportion of staff that have chosen not to declare their ethnicity.
| Ethnicity | Grade 2- 6 | Grade 7-8 | Grade 9-10 | RSM and Above |
|---|---|---|---|---|
| Asian/Asian British | 70.4% | 20.0% | 8.0% | 1.6% |
| Black/Black British | 80.0% | 14.6% | 3.8% | 1.5% |
| Mixed | 78.9% | 12.7% | 4.2% | 4.2% |
| Prefer not to say | 61.0% | 23.7% | 6.8% | 8.5% |
| Other ethnic group(s) | 60.0% | 40.0% | 0.0% | 0.0% |
| White British | 72.3% | 18.5% | 6.2% | 2.9% |
| White Other | 82.8% | 14.7% | 2.6% | 0.0% |
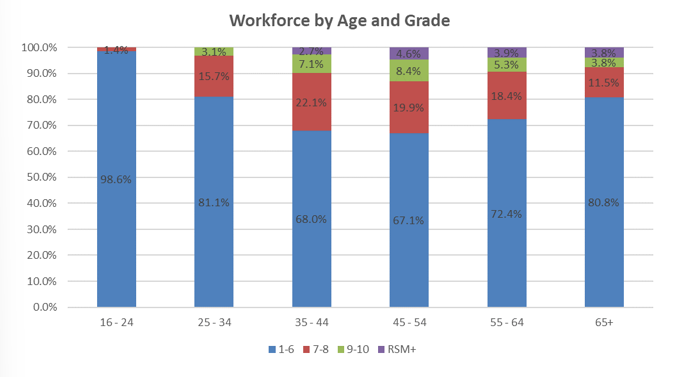
3.16 Grade by age profile
The pay grades of staff aged under 35 are lower than the older age groups, up to age 64. This is expected as in most cases staff are in the earlier stages of their careers. A larger percentage of those aged 55 to 64 are in the highest pay grades than any other age group.
| Age | Grades 1-6 | Grades 7-8 | Grades 9-10 | RSM and Above |
|---|---|---|---|---|
| 16 to 24 | 98.6% | 1.4% | – | – |
| 25 to 34 | 81.1% | 15.7% | 3.1% | – |
| 35 to 44 | 68.0% | 22.1% | 7.1% | 2.7% |
| 45 to 54 | 67.1% | 19.9% | 8.4% | 4.6% |
| 55 to 64 | 72.4% | 18.4% | 5.3% | 3.9% |
| 65+ | 80.8% | 11.5% | 3.8% | 3.8% |
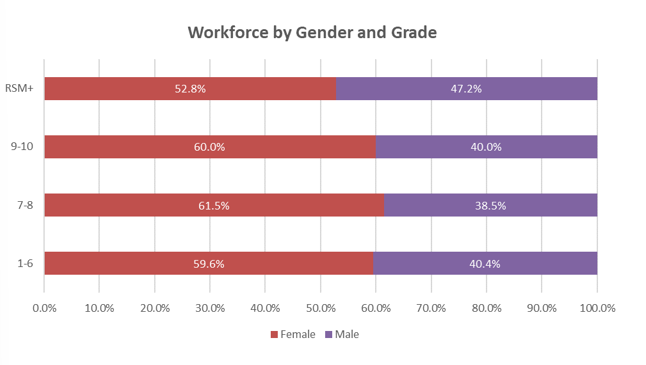
3.17 Grade by gender
There is a higher proportion of female workers in all categories.
| Gender | Grade 1-6 | Grade 7- 8 | Grade 9-10 | RSMD and Above |
|---|---|---|---|---|
| Female | 59.6% | 61.5% | 60.0% | 52.8% |
| Male | 40.4% | 38.5% | 40.0% | 47.2% |
4 Staff engagement and procedures
4.1 Quantitative and qualitative research with employees
An engagement survey for staff is completed annually and the results considered by demographic group. Staff groups are supported and share their insights with CMT members on a quarterly basis.
4.2 Due regard to the aims of the duty in decision-making
Equality Impact Assessments (EIAs) are carried out on all employment-related policies and procedures and general employment issues are discussed with the Trades Unions.
4.3 Staff complaints
There were no staff complaints recorded as instances of discrimination during the period which this report covers.
4.4 Engagement with trade unions and staff
The Council recognises Trades Unions and works with them in partnership to ensure that our HR&OD policies and practices support staff.
Staff Groups discuss ideas, issues, drafts of new policies, organisational change etc. in a spirit of free exchange of views. The various staff groups include participants from across the Council. Staff Group Chairs meet with the Chief Executive/a CMT member on a quarterly basis to discuss key staff issues and policy development. Union representatives also have a quarterly meeting with the Chief Executive. Management continues to consult and negotiate with Unions on matters that directly affect local working at the Council.
4.5 Policies and programmes to address equality concerns
The Council has a range of policies and programmes to address equalities concerns. Some examples of these include:
- Inclusion and Diversity Strategy and plan
- Equality, Diversity and Inclusion in Employment Policy
- Whistle-Blowing Policy
- Grievance Procedure
- Bullying and Harassment Policy and Procedure
HR Casework
Completed HR Casework – Use of Formal Procedures – April 2023 to March 2024 – Analysis by Employee Profile
| Case Type | All cases | Gender – Female | GM | Disability |
|---|---|---|---|---|
| Capability – Ill Health | 54 | 21 (38.9%) | 11 (20.4%) | 2 (3.7%) |
| Capability – Performance | 5 | 2 (40.0%) | 2 (40.0%) | 0 (0.0%) |
| Disciplinary | 20 | 5 (25.0%) | 2 (10.0%) | 1 (10.0%) |
| Grievance | 6 | 4 (66.7%) | 0 (0.0%) | 0 (0.0%) |
| Total | 85 | 32 (37.6%) | 15 (17.6%) | 3 (3.5%) |
Completed HR Casework – Use of Formal Procedures – April 2023 to March 2024 – Employee Profile Not Recorded
| Case Type | All cases | Gender – not recorded | GM – not recorded | Disability – not recorded |
|---|---|---|---|---|
| Capability – Ill Health | 54 | 0 (0.0%) | 16 (29.6%) | 28 (51.9%) |
| Capability – Performance | 5 | 0 (0.0%) | 3 (60.0%) | 5 (100.0%) |
| Disciplinary | 20 | 0 (0.0%) | 5 (25.0%) | 7 (35.0%) |
| Grievance | 6 | 0 (0.0%) | 2 (33.3%) | 4 (66.7%) |
| Total | 85 | 0 (0.0%) | 26 (30.6%) | 44 (51.8%) |
The Council also has a Flexible Working Policy that welcomes formal requests from employees who meet the necessary criteria. We recognise the importance of a work-life balance for all staff and will consider flexible working requests on an informal basis, accommodating these where they meet business needs.
4.6 Learning and development opportunities
The Council is committed to training and personal development. Every member of staff has a crucial role to play in enabling the Council to make a difference: to make the borough an even better place to be and to help meet the challenges faced within local communities. To that effect, the council has a People Strategy in place with the aim “to have the right people, in the right job, with the right skills”.
To deliver on this, the Council has a range of learning and development opportunities available including classroom courses, e-learning and a professional qualification support scheme as well as on-the-job training, and mentoring. The Council also has an integrated programme of leadership and management development.
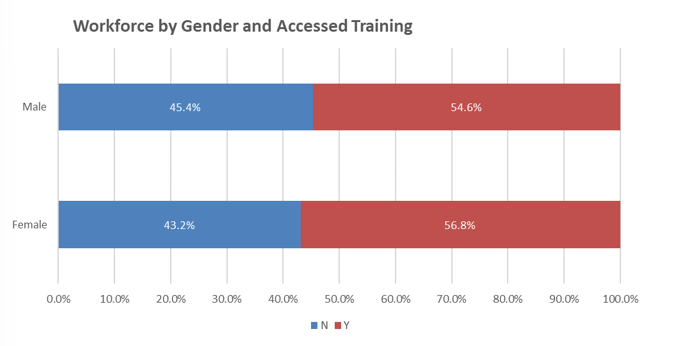
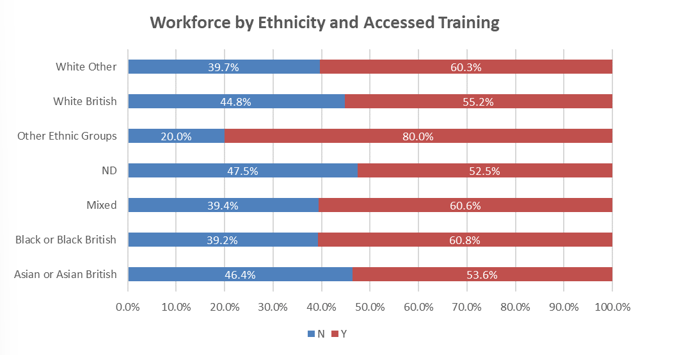
In 2023/24 55.9% of the total workforce accessed our corporate training, 43.2% of females accessed training and 60.8% of Black/ Black British staff accessed training compared to 55.2% of White British Staff.
| Gender | Number who accessed Training | Number who did not access Training |
|---|---|---|
| Female | 56.8% | 43.2% |
| Male | 54.6% | 45.4% |
| Ethnicity | Number who accessed Training | Number who did not access Training |
|---|---|---|
| Asian/Asian British | 53.6% | 46.4% |
| Black/Black British | 60.8% | 39.2% |
| Mixed | 60.6% | 39.4% |
| Prefer not to say | 52.5% | 47.5% |
| Other ethnic group(s) | 80.0% | 20.0% |
| White British | 55.2% | 44.8% |
| White Other | 60.3% | 39.7% |
Development opportunities can be identified in a variety of ways including by the individual through regular 1 to 1 meetings, and the performance appraisal process. Training courses, many of which are mandatory, delivered on an ongoing basis include: health and safety, first aid, stress resilience, equality and diversity, recruitment and selection, project management, Microsoft Office applications, data protection, lone working and managing aggressive behaviour.
4.7 Gender pay gap information
The council has been required to publish and report specific figures about its gender pay gap since 2017. Using the required snapshot date of 31 March 2023 for public sector organisations, the council was pleased to report a median gender pay gap of 0.0%. This showed the council was performing positively against the national average of 14.9% (in favour of men).
The council will be publishing it’s 2023 gender pay gap report on it’s website, and on the government reporting website, by 30 March 2024.
4.8 Ethnicity pay gap information
The Council has been required to publish and report specific figures about its gender pay gap since 2017. Using the required snapshot date of 31 March 2024 for public sector organisations, the Council was pleased to report a median gender pay gap of 0.0%. This showed the Council was performing positively against the national average of 14.9% (in favour of men).
In addition, the Council has voluntarily published ethnicity pay gap since 2020 and will also publish disability pay gap information for the first time this year.
The Council will be publishing pay gap information on its website, and on the government reporting website, by 30 March 2025.
[1] Equality Act 2010 – The ‘protected characteristics’ include: race, age, disability, religion and belief, sexual orientation, sex, gender reassignment, pregnancy and maternity and marriage and civil partnership is based on the last complete financial year (2022/23), unless otherwise indicated.
[2] As a Disability Confident employer, we have made specific commitments regarding the employment of disabled people. As part of this, a disabled person is guaranteed an interview if they meet the essential criteria for the job vacancy. See www.gov.uk/government/collections/disability-confident-campaign for more information
Last updated on 17/04/2025
Workforce profile